The graph below shows the population for India and China since the year 2000 and predicts population growth until 2050. Summarise the information by selecting and reporting the main features, and make comparisons where relevant. Write at least 150 words. IELTS 7 band essay -2023
Introduction
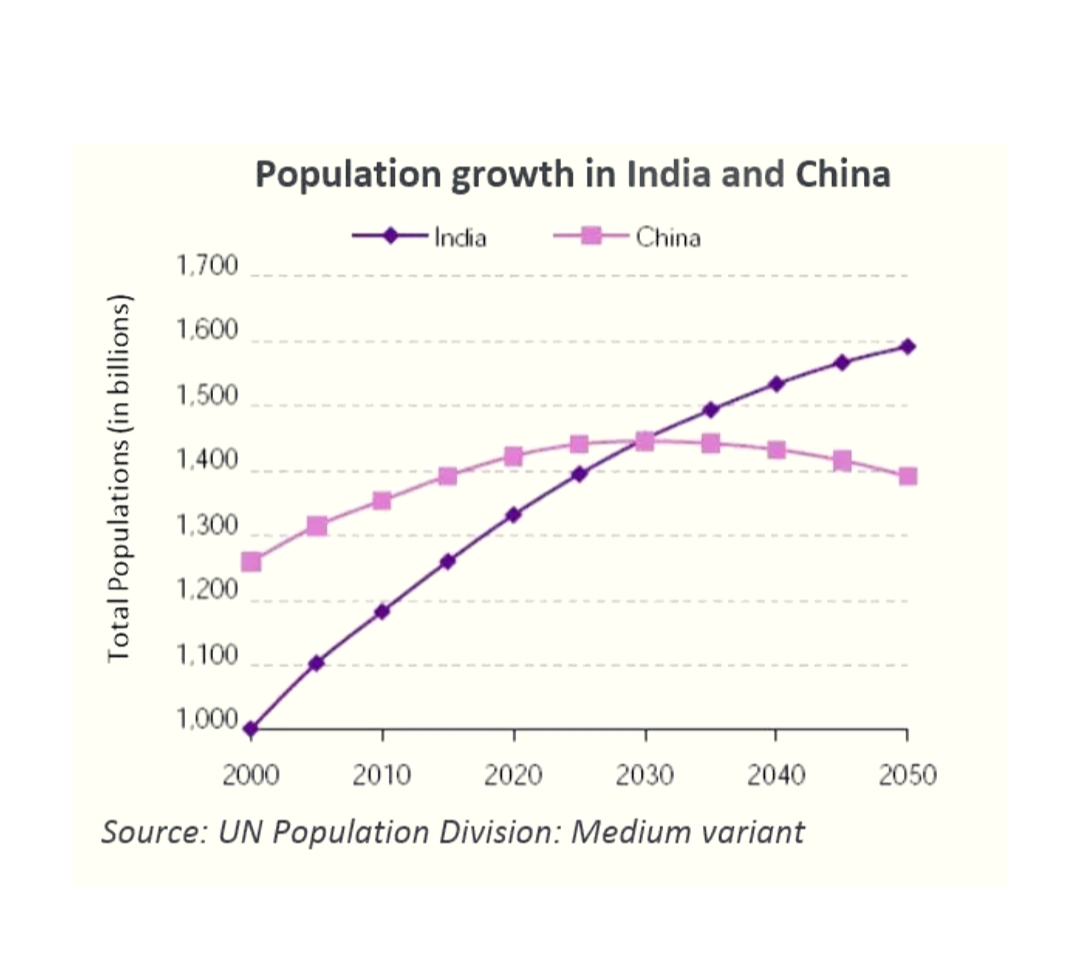
The graph displays the population change and the progress of India and China
from 2000 and also prognosticated their changes in the future.
Body paragraph 1
China had a population of1.25 billion people in 2000, which was 0.25 billion more than India’s population of 1 billion.
The number of Indian citizens increased by 0.2 billion between 2000 and 2010.
China’s population has risen by 0.1 billion people to over 1.35 billion in the same
time frame.
Body paragraph 2
According to the graph, India’s population would grow faster than China’s, and
experts predict that by 2030, both nations’ populations will equal i.e. 1.45 billion.
The population of China is also projected to decline slightly to1.4 billion in 2050,
while the population of India is projected to rise and reach 1.6 billion.
Conclusion
In conclusion, India’s population will thus continue to rise steadily over the
coming 50 times, catching China. China’s population, on the other hand, will reach
its peak in 2030 and also start to decline.


