The diagrams below give information on transport and car use in Edmonton. Summarise the information by selecting and reporting the main features, and make comparisons where relevant. Write at least 150 words. IELTS 7 band essay -2023
Introduction
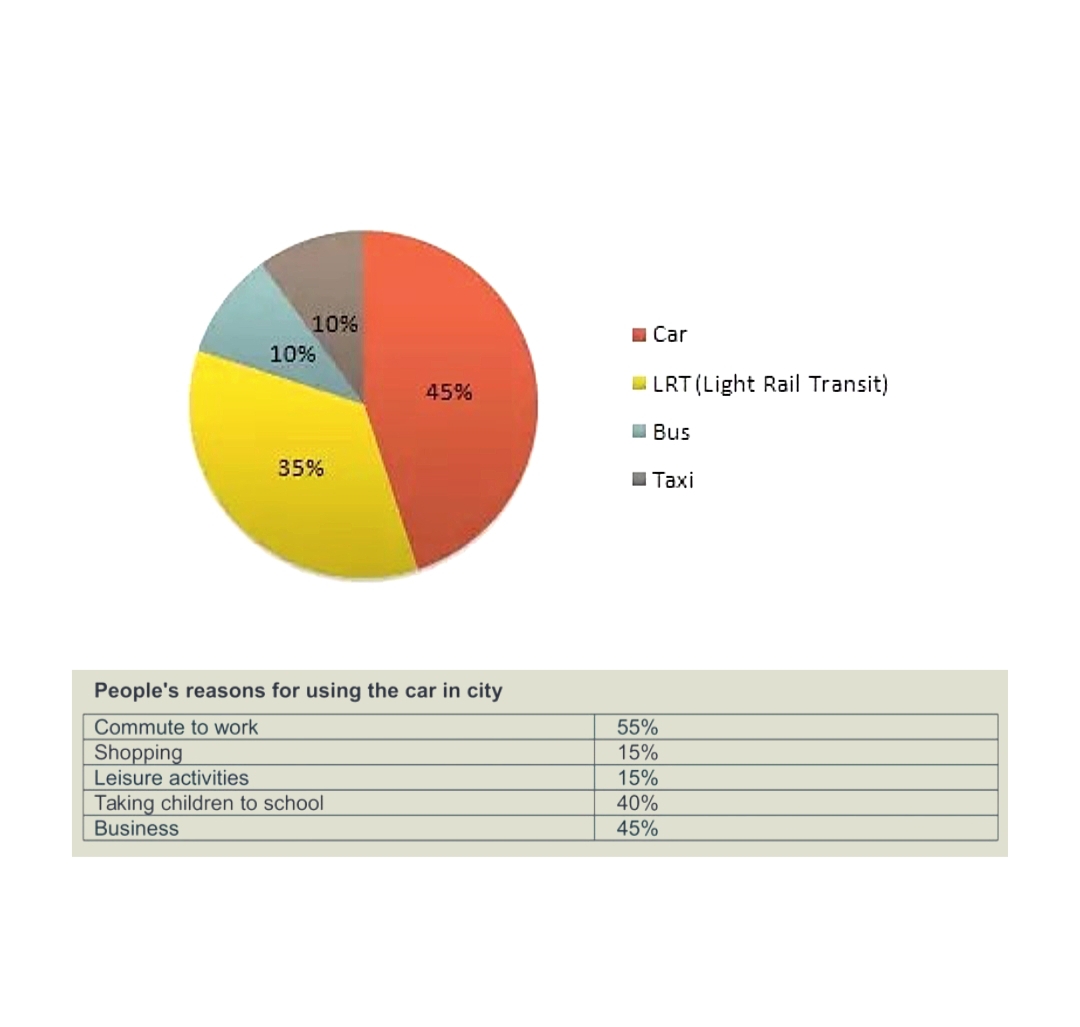
The various vehicle types and their utilization in Edmonton are depicted in the pie chart. The chart lists the five reasons people in Edmonton use cars. In general, city dwellers like their vehicles over LRT (Light Rail Transit), buses, and taxis and most people use their cars to get to work. In Edmonton, cars are preferred above other modes of transportation. Moreover, daily chores and business are the main drivers of car use in this city.
Body paragraph 1
According to the data, 45% of Edmonton city residents prefer to drive, compared
to exactly a tenth fewer who prefer the LRT system. Bus and taxi use makes up
the remaining 20% equally. This also implies that the number of drivers exceeds
the sum of the users of buses and taxis. Also, the proportion of LRT users is more
than three times that of bus and taxi users combined.
Body paragraph 2
Work travel makes up more than half of the reasons people drive in cities. In
Edmonton, the majority of residents use their cars to get to work, accounting for
55% of all car usage in the city. Cars are used by 45% of people for business and
40% of people uses them to drive their kids to school. 15% of people use cars for
shopping or leisure activities.
Conclusion
Overall, Edmonton residents have a variety of transportation options, but many rely heavily on their cars to get around.


